Data Glance
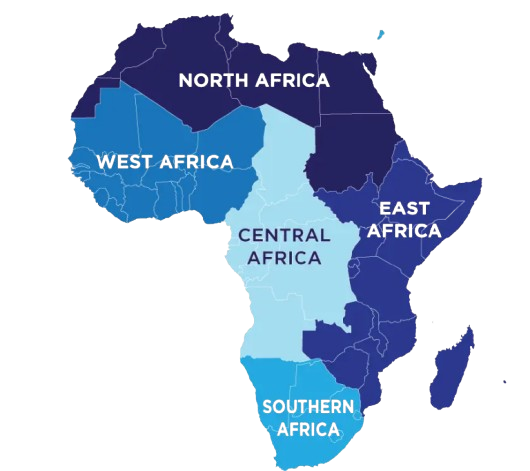
All Regions of Africa
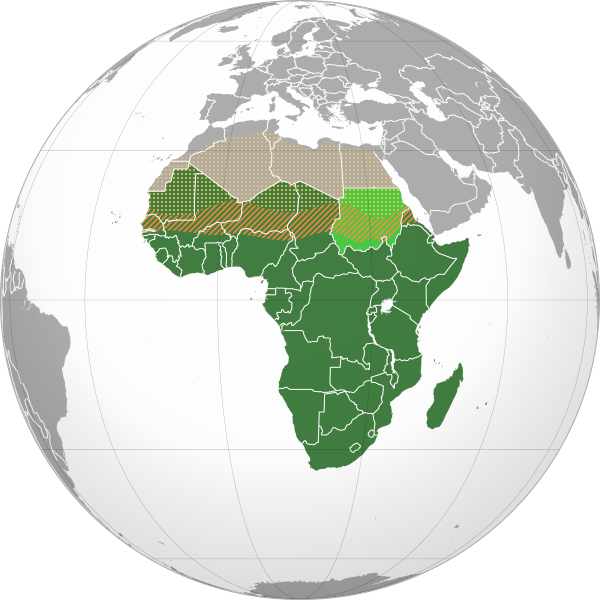
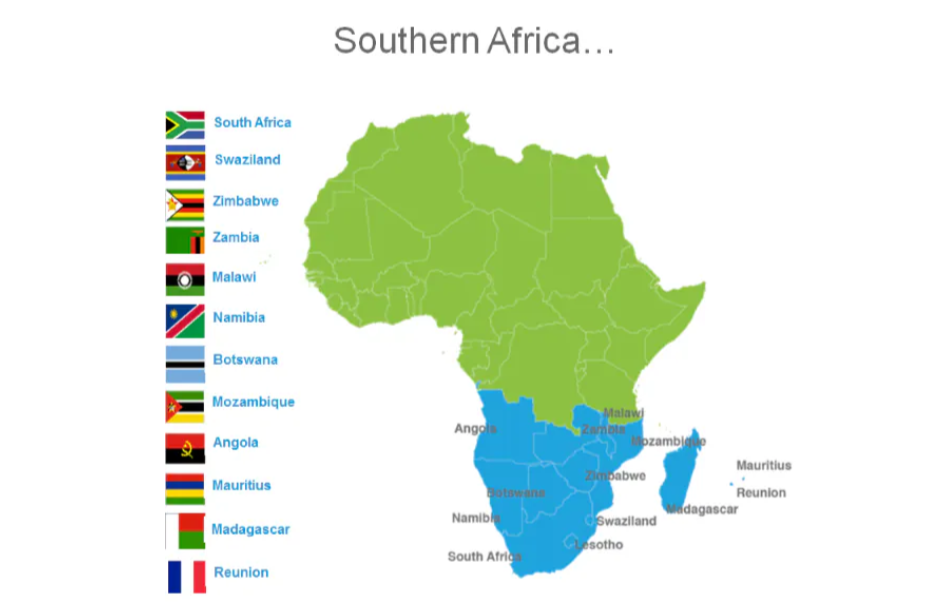
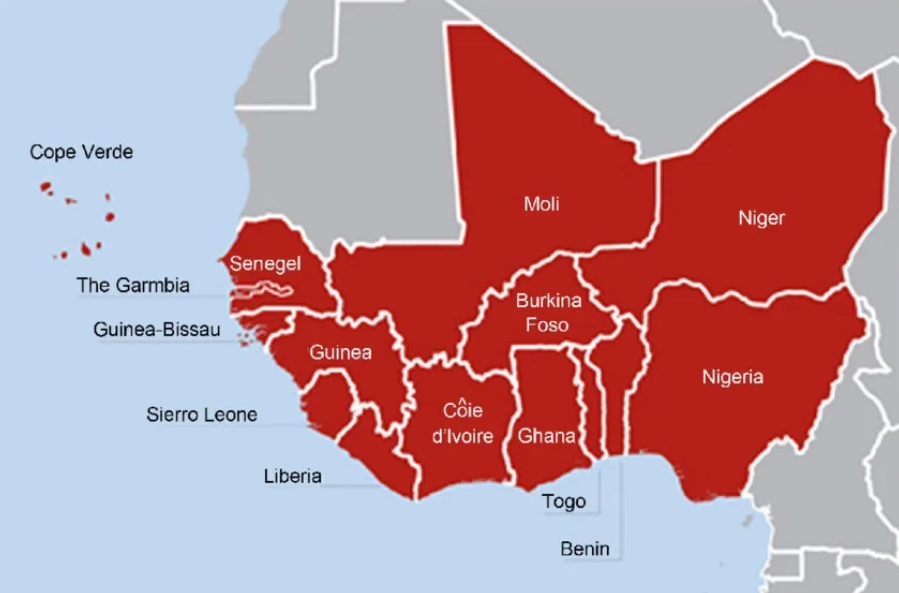
Regions of Sub-Saharan Africa
| s/n | Countries | Population | Active Workforce | Estimated Family Units | Estimated Housing Stock | Estimated Housing Deficit | Estimated Housing Deficit Percentage | Estimated Ownership Deficit | Estimated Ownership Deficit Percentage |
|---|---|---|---|---|---|---|---|---|---|
|
1 |
Cameroon
|
50,000,000 |
20,000,000 |
12,500,000 |
2,500,000 |
10,000,000 |
80% |
17,500,000 |
87.5% |
|
2 |
Central African Republic
|
2 |
2 |
2 |
2 |
2 |
2 |
2 |
2 |
|
3
|
Congo Brazaville |
3 |
3 |
3 |
3 |
3 |
3 |
3 |
3 |
|
4
|
Congo Kinshasa |
4 |
4 |
4 |
4 |
4 |
4 |
4 |
4 |
|
5 |
Chad Republic
|
5 |
5 |
5 |
5 |
5 |
5 |
5 |
5 |
|
6 |
Gabon |
6 |
6 |
6 |
6 |
6 |
6 |
6 |
6 |
|
7 |
Equitorial Guinea
|
7 |
7 |
7 |
7 |
7 |
7 |
7 |
7 |
|
8 |
Sao Tome & Principe
|
8 |
8 |
8 |
8 |
8 |
8 |
8 |
8 |
| s/n | Countries | Population | Active Workforce | Estimated Family Units | Estimated Housing Stock | Estimated Housing Deficit | Estimated Housing Deficit Percentage | Estimated Ownership Deficit | Estimated Ownership Deficit Percentage |
|---|---|---|---|---|---|---|---|---|---|
|
1 |
Burundi
|
50,000,000 |
20,000,000 |
12,500,000 |
2,500,000 |
10,000,000 |
80% |
17,500,000 |
87.5% |
|
2 |
Comoros |
2 |
2 |
2 |
2 |
2 |
2 |
2 |
2 |
|
3
|
Djibouti |
3 |
3 |
3 |
3 |
3 |
3 |
3 |
3 |
|
4
|
Eritrea |
4 |
4 |
4 |
4 |
4 |
4 |
4 |
4 |
|
5 |
Ethiopia |
5 |
5 |
5 |
5 |
5 |
5 |
5 |
5 |
|
6 |
Kenya |
6 |
6 |
6 |
6 |
6 |
6 |
6 |
6 |
|
7 |
Rwanda |
7 |
7 |
7 |
7 |
7 |
7 |
7 |
7 |
|
8 |
Seychelles
|
8 |
8 |
8 |
8 |
8 |
8 |
8 |
8 |
|
9 |
Somalia
|
9 |
9 |
9 |
9 |
9 |
9 |
9 |
9 |
|
10 |
South Sudan |
10 |
10 |
10 |
10 |
10 |
10 |
10 |
10 |
|
11 |
Sudan |
11 |
11 |
11 |
11 |
11 |
11 |
11 |
11 |
|
12 |
Rwanda |
12 |
12 |
12 |
12 |
12 |
12 |
12 |
12 |
|
13 |
Tanzania |
13 |
13 |
13 |
13 |
13 |
13 |
13 |
13 |
| s/n | Countries | Population | Active Workforce | Estimated Family Units | Estimated Housing Stock | Estimated Housing Deficit | Estimated Housing Deficit Percentage | Estimated Ownership Deficit | Estimated Ownership Deficit Percentage |
|---|---|---|---|---|---|---|---|---|---|
|
1 |
Angola
|
50,000,000 |
20,000,000 |
12,500,000 |
2,500,000 |
10,000,000 |
80% |
17,500,000 |
87.5% |
|
2 |
Botswana |
2 |
2 |
2 |
2 |
2 |
2 |
2 |
2 |
|
3
|
Eswatini |
3 |
3 |
3 |
3 |
3 |
3 |
3 |
3 |
|
4
|
Lesotho
|
4 |
4 |
4 |
4 |
4 |
4 |
4 |
4 |
|
5 |
Madagascar
|
5 |
5 |
5 |
5 |
5 |
5 |
5 |
5 |
|
6 |
Malawi |
6 |
6 |
6 |
6 |
6 |
6 |
6 |
6 |
|
7 |
Mauritius |
7 |
7 |
7 |
7 |
7 |
7 |
7 |
7 |
|
8 |
Mozambique |
8 |
8 |
8 |
8 |
8 |
8 |
8 |
8 |
|
9 |
South Africa |
9 |
9 |
9 |
9 |
9 |
9 |
9 |
9 |
|
10 |
Zambia |
10 |
10 |
10 |
10 |
10 |
10 |
10 |
10 |
|
11 |
Zimbabwe |
11 |
11 |
11 |
11 |
11 |
11 |
11 |
11 |
| s/n | Countries | Population | Active Workforce | Estimated Family Units | Estimated Housing Stock | Estimated Housing Deficit | Estimated Housing Deficit Percentage | Estimated Ownership Deficit | Estimated Ownership Deficit Percentage |
|---|---|---|---|---|---|---|---|---|---|
|
1 |
Benin |
50,000,000 |
20,000,000 |
12,500,000 |
2,500,000 |
10,000,000 |
80% |
17,500,000 |
87.5% |
|
2 |
Burkina Faso |
2 |
2 |
2 |
2 |
2 |
2 |
2 |
2 |
|
3
|
Carbo Verde
|
3 |
3 |
3 |
3 |
3 |
3 |
3 |
3 |
|
4
|
Cote D’Ivoire
|
4 |
4 |
4 |
4 |
4 |
4 |
4 |
4 |
|
5 |
Ghana
|
5 |
5 |
5 |
5 |
5 |
5 |
5 |
5 |
|
6 |
Guinea |
6 |
6 |
6 |
6 |
6 |
6 |
6 |
6 |
|
7 |
Guinea Bissau |
7 |
7 |
7 |
7 |
7 |
7 |
7 |
7 |
|
8 |
Liberia |
8 |
8 |
8 |
8 |
8 |
8 |
8 |
8 |
|
9 |
Mali |
9 |
9 |
9 |
9 |
9 |
9 |
9 |
9 |
|
10 |
Niger |
10 |
10 |
10 |
10 |
10 |
10 |
10 |
10 |
|
11 |
Nigeria |
11 |
11 |
11 |
11 |
11 |
11 |
11 |
11 |
|
12 |
Senegal
|
12 |
12 |
12 |
12 |
12 |
12 |
12 |
12 |
|
13 |
Sierra Leone |
13 |
13 |
13 |
13 |
13 |
13 |
13 |
13 |
|
14 |
The Gambia |
14 |
14 |
14 |
14 |
14 |
14 |
14 |
14 |
|
15 |
Togo |
15 |
15 |
15 |
15 |
15 |
15 |
15 |
15 |